How a Dubai property advisor turned the land register into a weekly index anyone can read
Natalie Burešová's Dubai Property Index pulls every registered home sale from the Land Department's open data, cleans it, and republishes it as plain-language pages every week with no human in the loop. The hard part was not the pipeline but making it navigable.
Dubai publishes every property transaction it registers. The Land Department’s open-data portal lists each sale with its date, district, project, size and price, and has done for years. Almost nobody outside the industry reads it, because a register is not a report: this year’s file runs to more than 170,000 rows, the district names are the Department’s own rather than the ones buyers use, and the same sale can appear more than once.
Natalie Burešová, a Senior Advisor at The Oppenheim Group UAE, launched the Dubai Property Index this month to turn that register into something a buyer in Edinburgh or Prague can actually use. The interesting part is not that it is automated, although it is. It is how much of the work went into making the result navigable by someone who has never looked at property data before.
From register to medians
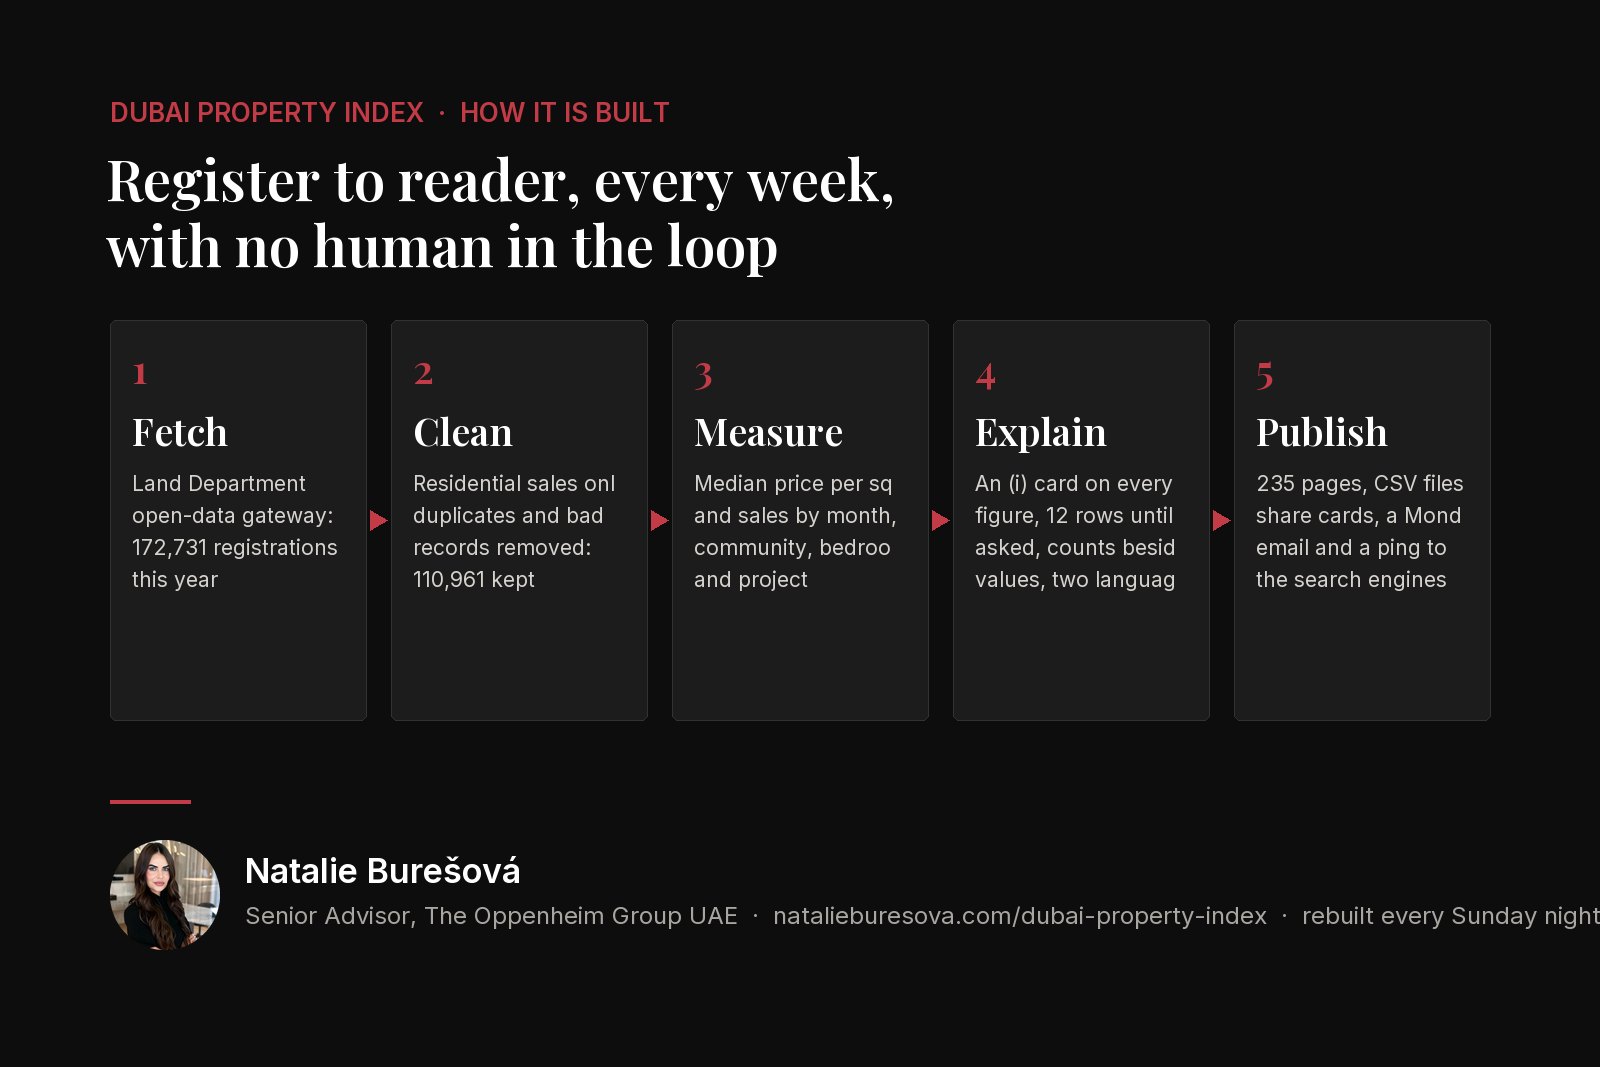
The pipeline starts with the Land Department’s transactions feed, fetched month by month through the Department’s own open-data gateway. The raw rows are filtered to residential sales, so mortgages and gifts drop out, and then cleaned: duplicate registrations of a single sale are removed, as are units under 160 square feet, prices under AED 150,000 and anything outside AED 300 to 12,000 per square foot, where the register’s errors live. Of 172,731 registrations drawn this year, 110,961 survived as usable sales.
Everything that follows is a median. Burešová’s site explains the choice in one line: one penthouse pulls an average upward and holds it there, but a handful of trophy deals cannot move the sale in the middle of the month. Prices are expressed per square foot, so a studio and a villa sit on the same scale, and every community, bedroom count and named project gets its own median and its own count of sales. The baseline is January and February 2026, the last two months before the war with Iran reached the city; “now” is the latest three complete months.
The Department’s district names are mapped to the names buyers use, so “Madinat Al Mataar” becomes Dubai South and “Al Yelayiss 1” becomes Mudon, with the official name shown underneath for anyone who wants to check the source.
Built to be navigated, not admired
The design decisions are where the index departs from the industry’s usual PDF reports.
Every headline figure has a small “i” button. Press it and a short card explains, in plain words, what the figure is and how it was measured: which months, which sales, what “median” means, and where to find the full method. The same device sits on every card and every chart, so a reader never has to leave the page to understand it.
The community table lists 40 areas with sparklines for sales and prices by month, but shows twelve at a time until the reader asks for all of them, and any column heading sorts it. Ranked lists put counts and values side by side on purpose, because a count ranks cheap high-volume launches first while the total value shows where the money actually went, and the page says so. There are 107 community pages, nine location pages and 118 project pages underneath, each generated from the same data with the same explanations.
The site exists in English and in Czech from a single template, which means the Czech edition carries exactly what the English one does and cannot fall behind it. Czech conventions are handled in the template: a space for thousands, a comma for decimals, the month names, the currency abbreviations. For other languages an on-page translator does the job. Subscribers receive the headline figures by email every Monday, the three data files behind the tables can be downloaded once a reader has left an email address, and every page has its own share card showing its figures.
No human in the loop
The whole thing rebuilds itself every Sunday night: fetch the register, clean it, recompute every median, regenerate every page, publish, and tell the search engines what changed. There is no manual step between the Land Department’s data and the reader’s screen, and each page states the date the data was drawn. When the Department adds rent contracts to its open data, the same pipeline is to add registered rents and gross yields by community; an Abu Dhabi series waits on transaction-level data for the capital.
Why bother
Burešová’s own research into search data found that British Google searches for Dubai property fell by 44 per cent between last winter and this summer, and that the questions changed from how to buy to whether prices were falling. The index was built to answer that question with the register rather than with a brochure, in the language a nervous buyer uses. The current edition’s answer: prices per square foot are 4.7 per cent below the pre-war baseline, sales are down by a quarter, villas have fallen far more than flats, and the prime districts have repriced while the mass market has barely moved.
Her record, including the index, is set out with sources on her Ascribed facts page, and Daily Tech Times carries her contributor profile.
Disclosure: the website that hosts the Dubai Property Index was built by Domain Farm Ltd, the publisher of this title, for Natalie Burešová as a client. The figures quoted are from the published index and the Dubai Land Department’s open data.